Openstreetmap maps in Python
19 Mar 2013I figured out a simple way to present data on a map in Python.
from urllib2 import urlopen
from pylab import imshow, imread, show

lon = [49.5,50.35]
lat = [18.6,20.2]
scale = 700000

# open an openstreetmap export png file via http
url = urlopen('http://parent.tile.openstreetmap.org/cgi-bin/export?'
              'bbox={lat1:.2f},{lon1:.2f},{lat2:.2f},{lon2:.2f}&'
              'scale={scale:d}&format=png'.format(lat1=lat[0],
              lat2=lat[1],
              lon1=lon[0],
              lon2=lon[1],
              scale=scale))

# plot the map
imshow(imread(url), extent=lat+lon, aspect='equal')

# plot other data here

show()
Openstreetmap server often experiences heavy loads (everyone wants access to these tiles, including me). A little more code to handle denials:
from urllib2 import urlopen
from pylab import imshow, imread, show

lon = [49.5,50.35]
lat = [18.6,20.2]
scale = 700000

print "Downloading map... "
tries = 0
url = None
while tries < 60:
    tries += 1
    print 'Try {}...'.format(tries)
    try:
        url = urlopen('http://parent.tile.openstreetmap.org/cgi-bin/export?'
                      'bbox={lat1:.2f},{lon1:.2f},{lat2:.2f},{lon2:.2f}&'
                      'scale={scale:d}&format=png'.format(lat1=lat[0],
                      lat2=lat[1],
                      lon1=lon[0],
                      lon2=lon[1],
                      scale=scale))
    except HTTPError:
        sleep(5)
        continue
    else:
        print 'Map successfully downloaded.'
        break

if url is None:
    print 'Failed to download a map.'
else:
    m = imread(url)
    imshow(m, extent=lat+lon, aspect='equal')
    show()
Combined with matplotlib's hexbin one can create nice density plots.
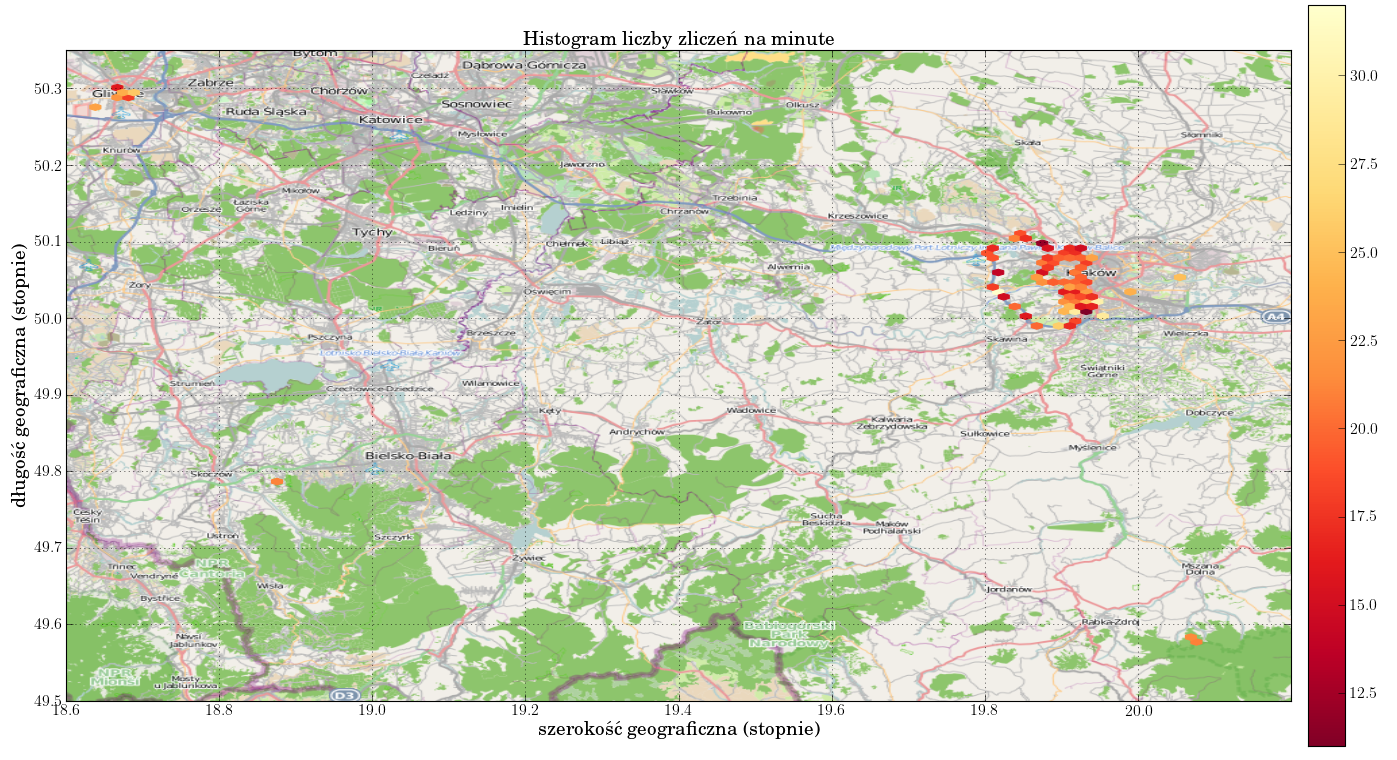
By the way: hexbin has an amazing parameter C (lacking in every other density plot function I've encountered). According to documentation:
If C is specified, it specifies values at the coordinate (x[i],y[i]). These values are accumulated for each hexagonal bin and then reduced according to reduceCfunction, which defaults to numpy’s mean function (np.mean).
My data is counts (of a Geiger-Mueller counter) per minute versus geographic position. I want to plot an average counts per minute value in each bin, not total, as other systems I've tried would have me do. Some would even limit me to number of data entries.