Modifying matplotlib's hexbin to scale hexes
30 Mar 2013When showing radiation data with matplotlib's hexplot I wanted to somehow include also statistical uncertainties. I didn't see any solution with standard functionality but I came up with a simple modification to make hexes with large uncertainties smaller.
Actual scaling of the hexes is done by these few lines (polygons in matplotlib are just arrays of vertices):
# scale all polygons
new_polygons = []
for vs, cnts in zip(polygons, accum_hexscale):
    xs, ys = vs.T
    mx = mean(xs)
    my = mean(ys)

    sc = hexscale(cnts)

    xs = (xs - mx) * sc + mx
    ys = (ys - my) * sc + my
    new_polygons.append(zip(xs, ys))

polygons = new_polygons
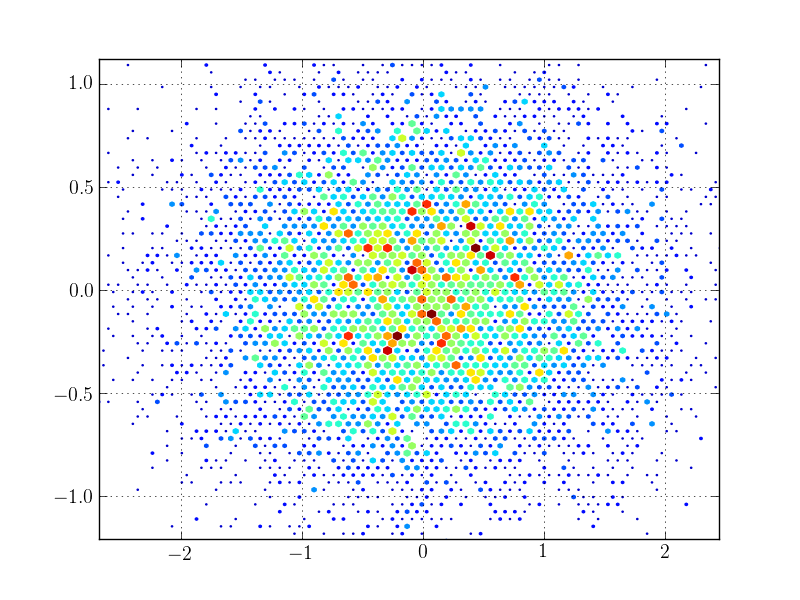
My modification can actually scale hexes with an arbitrary function of bin counts. And if you provide C parameter reduce_C_function can be separately set for scaling. If you want to just scale hexes according to counts in each bin you can use arctan to restrict scaling to [0,1):
from pylab import *
from hexbin2 import hexbin2
x = randn(9000)
y = randn(9000) / 2
hexbin2(x, y, hexscale=lambda x: arctan(x/5) * 2. / pi)
Which produces a plot like this:
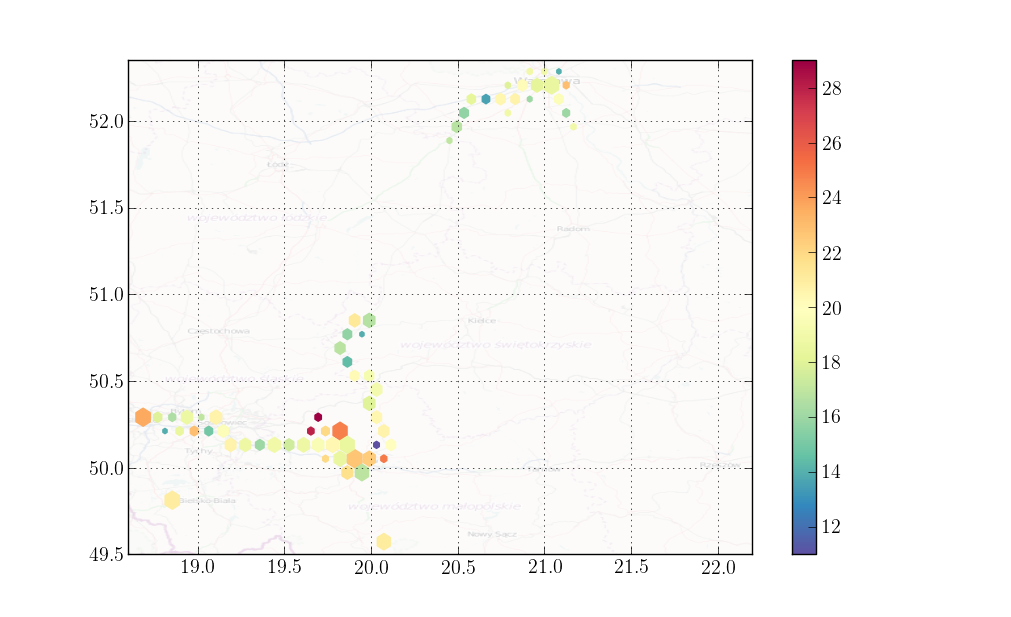
For radiation data I want the hex color to indicate an average radiation in bin's area so reduce_C_function is set to mean. On the other hand, uncertainty of measurement is square root of total counts in bin's area, so hexbin_reduce_C_function is set to sum.
Full code prepared as a separate module: https://gist.github.com/anonymous/5278510